
What does it take to win on the PGA TOUR? We know that winners shoot the lowest score, but a strokes gained analysis can show where winners gain the most strokes on the field.
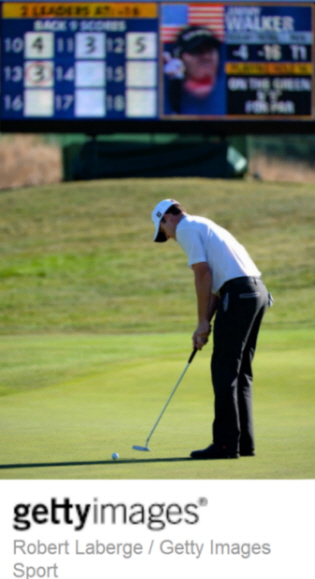
In the 2013-2014 TOUR season, there have been 23 winners of tournaments with ShotLink data recorded for all four rounds. The next table ranks winners from the ones who gained the most from strokes inside 100 yards (that is, short game and putting) to those who gained the least. At the two extremes are Jimmy Walker and Justin Rose. At the 2013 Frys.com Open, Jimmy Walker’s short game and putting contributed 99 percent of the strokes he gained on the field. At the 2014 Quicken Loans National, Justin Rose’s short game and putting contributed 15 percent of the strokes he gained on the field. Jimmy Walker won because of his touch inside 100 yards. Justin Rose won because of his ball striking outside 100 yards (that is, his driving and approach shots). There are many different ways to win a TOUR event!
Winners gained an average of 3.4 strokes per round on the field. Shots outside 100 yards (that is, driving and approach shots) contributed an average gain of 1.45 strokes per round, or 43 percent of the total. Shots inside 100 yards (that is, short game shots and putting) contributed an average gain of 1.94 strokes per round, or 57 percent of the total.
| Winners during win | Total SG | SG Drive+Appr | SG Short+Putt | Fraction Short+Putt |
| Winner | ||||
| Jimmy Walker @Frys.com | 3.41 | 0.03 | 3.38 | 99% |
| Brendon Todd | 3.95 | 0.24 | 3.71 | 94% |
| Ben Crane | 3.27 | 0.56 | 2.71 | 83% |
| Matt Jones | 4.10 | 1.14 | 2.96 | 72% |
| Chris Kirk | 3.61 | 1.02 | 2.60 | 72% |
| John Senden | 3.13 | 0.89 | 2.24 | 72% |
| Patrick Reed | 2.86 | 0.86 | 2.00 | 70% |
| J.B. Holmes | 3.87 | 1.17 | 2.70 | 70% |
| Matt Every | 3.70 | 1.15 | 2.55 | 69% |
| Kevin Streelman | 3.36 | 1.17 | 2.19 | 65% |
| Webb Simpson | 4.51 | 1.64 | 2.87 | 64% |
| Russell Henley | 2.53 | 1.11 | 1.42 | 56% |
| Matt Kuchar | 3.58 | 1.63 | 1.95 | 54% |
| Steven Bowditch | 3.28 | 1.69 | 1.59 | 48% |
| Jimmy Walker @Valero | 3.39 | 1.86 | 1.53 | 45% |
| Zach Johnson | 2.33 | 1.32 | 1.02 | 44% |
| Martin Kaymer | 3.39 | 1.99 | 1.40 | 41% |
| Seung-Yul Noh | 4.02 | 2.50 | 1.52 | 38% |
| Kevin Stadler | 3.69 | 2.32 | 1.37 | 37% |
| Hideki Matsuyama | 3.18 | 2.01 | 1.17 | 37% |
| Bubba Watson | 3.84 | 2.81 | 1.03 | 27% |
| Adam Scott | 2.44 | 2.05 | 0.39 | 16% |
| Justin Rose | 2.65 | 2.26 | 0.39 | 15% |
| Average | 3.40 | 1.45 | 1.94 | |
| Fraction of total | 100% | 43% | 57% |
From these results, you might conclude that players who are great from inside 100 yards are more likely to win TOUR events. But this conclusion is not correct.
The next table shows the strokes gained of the top 23 players in the FedEx Cup point standings. These players gained an average of 1.45 strokes per round on the field in the season, with 59 percent of the gain coming from shots outside 100 yards and 41 percent coming from shots inside 100 yards.
| Top 23 in FedEx Cup points | Total SG | SG Drive+Appr | SG Short+Putt | Fraction Short+Putt |
| Golfer | ||||
| Jimmy Walker | 1.66 | 0.77 | 0.89 | 54% |
| Bubba Watson | 2.11 | 1.45 | 0.66 | 31% |
| Matt Kuchar | 1.87 | 0.93 | 0.94 | 50% |
| Dustin Johnson | 1.65 | 1.48 | 0.16 | 10% |
| Jordan Spieth | 1.52 | 0.53 | 0.99 | 65% |
| Martin Kaymer | 0.83 | 1.19 | -0.36 | -43% |
| Chris Kirk | 1.13 | 0.54 | 0.58 | 52% |
| Patrick Reed | 0.32 | -0.16 | 0.48 | 152% |
| Harris English | 1.21 | 0.99 | 0.23 | 19% |
| Brendon Todd | 1.25 | 0.05 | 1.20 | 96% |
| Kevin Na | 1.35 | 0.50 | 0.85 | 63% |
| Justin Rose | 1.66 | 1.08 | 0.58 | 35% |
| Adam Scott | 2.02 | 1.20 | 0.82 | 40% |
| Jim Furyk | 1.63 | 1.07 | 0.55 | 34% |
| Matt Every | 1.24 | 0.26 | 0.97 | 79% |
| Webb Simpson | 1.32 | 0.16 | 1.16 | 88% |
| Zach Johnson | 1.06 | 0.54 | 0.52 | 49% |
| Ryan Moore | 1.45 | 1.12 | 0.32 | 22% |
| Hideki Matsuyama | 1.89 | 1.56 | 0.33 | 18% |
| Sergio Garcia | 2.73 | 2.06 | 0.66 | 24% |
| John Senden | 1.06 | 0.43 | 0.63 | 60% |
| Charley Hoffman | 1.37 | 1.09 | 0.28 | 20% |
| Keegan Bradley | 1.07 | 0.87 | 0.20 | 19% |
| Average | 1.45 | 0.86 | 0.59 | |
| Fraction of total | 100% | 59% | 41% |
In the week of a win, tournament winners gain more from shots inside 100 yards than from outside 100 yards. The reverse happens for FedEx Cup leaders: During the season, FedEx Cup leaders gain more from shots outside 100 yards than inside 100 yards.
To understand what type of golfer is more likely to win a tournament, it is important to look at season-long performance, not just performance in the week of a win. The players most likely to win a tournament are those who gain more strokes on the field in the season. These players tend to gain more of their strokes on shots starting outside of 100 yards than inside 100 yards.
Don’t believe me? In fact, if you look at the season-long performance of winners (not just the week in which they win), more of their strokes gained on the field come from shots starting outside of 100 yards (54 percent) than from shots starting inside of 100 yards (46 percent).
The winners were the best players for one week. The top 23 FedEx players were the best overall for the season so far. There is considerable overlap between the two lists: Fourteen players are in the top 23 in FedEx Cup points and have won a tournament. I’m willing to bet that winners of future tournaments are more likely to come from the FedEx Cup list than from the winners list.
| Winners during win | Total SG | Drive+Appr | Short+Putt |
| Average | 3.40 | 1.45 | 1.94 |
| Fraction of total | 100% | 43% | 57% |
| Winners during season | Total SG | Drive+Appr | Short+Putt |
| Average | 1.00 | 0.54 | 0.46 |
| Fraction of total | 100% | 54% | 46% |
| Top 23 in FedEx Cup points | Total SG | Drive+Appr | Short+Putt |
| Average | 1.45 | 0.86 | 0.59 |
| Fraction of total | 100% | 59% | 41% |
This post appeared originally on pgatour.com here