
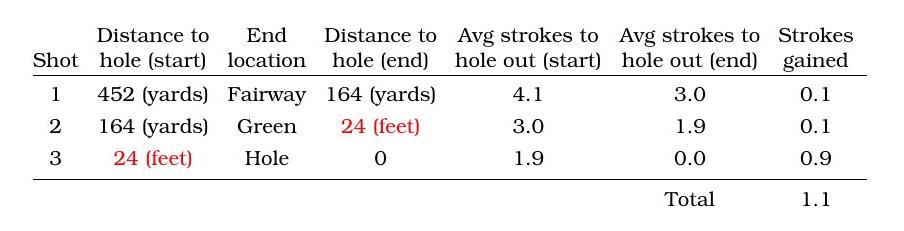
p.87: the putt distance is 24 feet, not 24 yards.
Table 5.4: Strokes gained example: Tiger Woods at Bay Hill. The decrease in the average number of strokes to hole out is the “average strokes to hole out at the start of the shot” minus the “average strokes to hole out at the end of the shot.” This decrease minus one (to account for the shot itself) is the strokes gained of the shot. The example shows Tiger Woods’ play on the 18th hole of the fourth round of the 2008 Arnold Palmer Bay Hill Invitational.
p.100: “The top third of pro golfers in distance hit drives eight yards longer than average-distance pros and score 0.3 strokes per round better.”
p.136: the uphill putt illustration on the right is incorrect in the book; the correct illustration is given below.
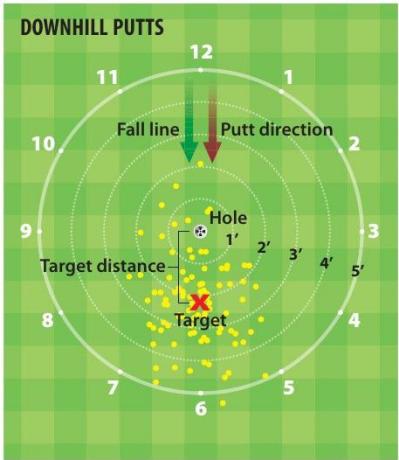
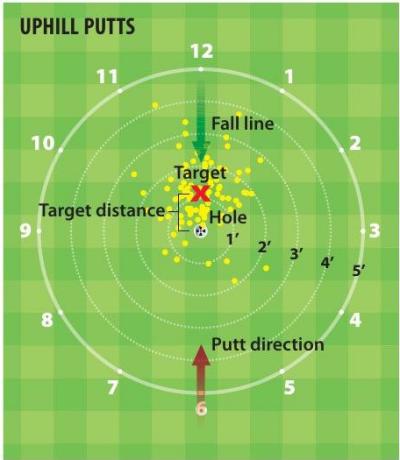
Figure 7.2: Scatter patterns of missed four-foot putts for PGA Tour pros on greens between one and two degrees of slope, with an average slope of 1.4 degrees. The left green shows downhill putts, with a target 2.2 feet beyond the hole. The right green shows uphill putts, with a target 1.2 feet beyond the hole. PGA Tour pros sink 87% of the four-foot downhill putts and leave 1.0% short; they sink 89% of the uphill putts and leave 1.2% short.
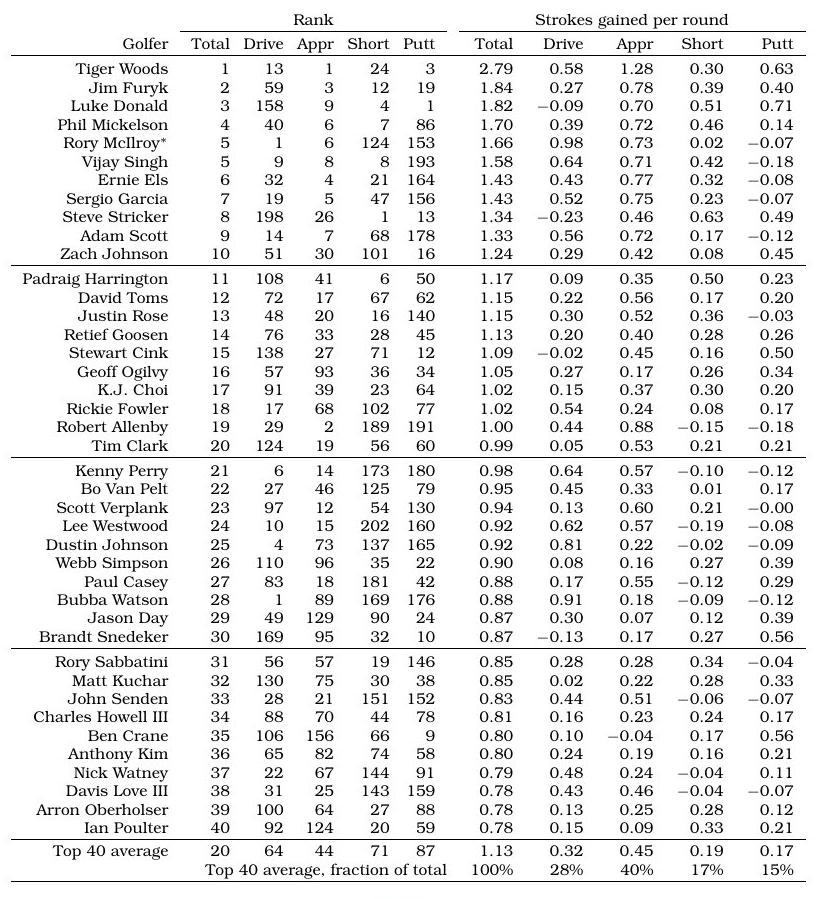
p.115: In Table 6.4 several of the ranks in the “Drive” and “Appr” columns are incorrect.
Table 6.4: Total strokes gained per round broken down by shot category: top forty golfers in total strokes gained on the PGA Tour from 2004 through 2012. Ranks are out of 240 golfers with at least 200 rounds during 2004-2012 (also included is Rory McIlroy with only 120 rounds).
p.181, the last line of “Recovery Shot Risk Analysis,” [0.1] should be [1.0]:
The breakeven probability is 72%, because the 72% chance of gain of 0.4 strokes matches the 28% chance of a loss of one stroke (0.72[0.4] = 0.28[1.0]).